Why is climate change data important? According to the World Meteorological Organization (WMO), “decision-makers need accessible, credible and relevant climate information to increase resilience to the more intense and frequent weather extremes” brought about by climate change. In other words, climate change data is crucial for shaping policy, actions and raising awareness of climate change.
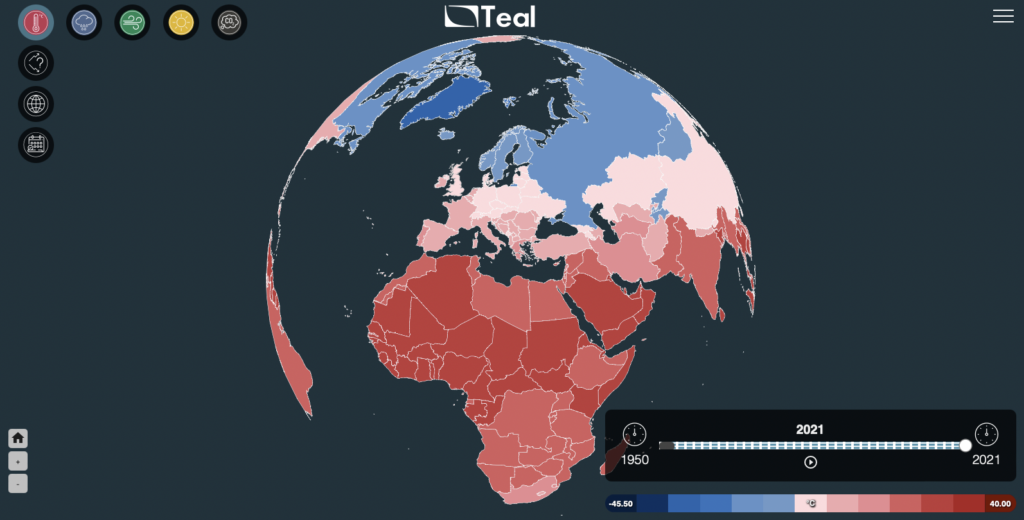
Towards making climate information and data available to all, UN CC:Learn has recently affiliated the Teal Tool to help everyone make sense of data on carbon emissions and other climate variables, such as air temperature, precipitation levels, wind speed and solar radiation. Teal is a free tool that enables you to explore this data visually and interactively from 1950 to near real time. It’s been developed by World Energy and Meteorology Council, with support from Climate Change Service and SECLI-FIRM, and is powered by Copernicus.
Teal’s smooth user experience makes it a user-friendly tool to everyone without prior knowledge or technical expertise on climate change. A few of Teal’s benefits are:
- It helps policymakers, experts, researchers, or enthusiasts to plan short- and long-term scenarios.
- It helps to raise awareness about climate change by providing key, clean and visually appealing data in the form of infographics.
- It supports everyone in managerial roles in taking the best and most climate-friendly decisions.
With Teal, in just few clicks you can visualize and download the data, as well as graphs, that can be used to inform your decisions, presentations and more. Follow the steps below or check this video to facilitate your navigation through Teal’s resources:
- Select a variable from the coloured icons at the top of the page;
- Hover over the desired country to get the data related to it;
- By clicking on a country, you’ll get graphs showing how the selected data evolved over time
- Add filters by clicking on the two icons on the left-hand side of the page to explore additional data features.
Tip! – Click on the map to rotate the globe.
Get first-hand updates from Teal on Instagram.